Engineering with automated fault detection and diagnostics
Building engineers and commissioning professionals can use automated fault detection and diagnostics, which has been more commonly used to save building energy and facilitate predictive maintenance
Learning Objectives
- Understand how automated fault detection and diagnostics works, along with its benefits.
- Learn different fault detection and diagnostics methods and AFDD tool capabilities available in today’s market.
- Know the future development of AFDD in HVAC systems — and challenges down the road.
Large commercial buildings are equipped with dozens of air handling units and hundreds of terminal boxes that maintain acceptable indoor air quality and occupant thermal comfort. Building operators are typically buried in the heating, ventilation and air conditioning system data, and mostly react to occupant complaints, equipment/component failure or various levels of building automation system alarms.
![]()
Automated fault detection and diagnostics, or AFDD, serves as a promising solution to process the big data flowing from the BAS and efficiently monitor the HVAC system operation with limited manpower.
AFDD has been an active area of HVAC application research and commercial development in the building industry for decades. AFDD is a two-step process that automates the detection of faults and the diagnostics of their causes. Studies have documented and validated the economic benefit of AFDD. Experts from Lawrence Berkeley National Laboratory analyzed the annual consumption data before and after the implementation of AFDD technologies and concluded that 26 organizations that use AFDD across 550 buildings and 97 million square feet achieved median savings of 8%.
Initiated by the Department of Energy, the Smart Energy Analytics Campaign was a four-year public-private partnership to expand the use of energy management and information systems and ongoing monitoring practices in commercial buildings. The campaign participants, including 104 commercial organizations across the United States totaling 567 million square feet of gross floor area and more than 6,500 buildings, achieved a median savings of 9% after using AFDD for only two years, close to the median savings of 8% in the previous research.
Not limited to energy savings, AFDD technologies can also prevent energy performance degradation over time, support various commissioning processes, improve operational efficiencies and facilitate predictive maintenance, which contributes to increased equipment life, improved reliability and lower labor cost.
There is agreement about the importance of AFDD in ongoing commissioning facilities management to avoid building energy performance drift. But other commissioning activities are currently still performed manually as labor-intensive and undefined processes. As HVAC systems grow more complex, the effort required in commissioning will increase, as well as the cost.
Eventually, an automated life cycle commissioning process becomes necessary — AFDD technologies could be deployed in all possible commissioning phases, including new construction commissioning, re-commissioning, retro-commissioning and ongoing commissioning or monitoring-based commissioning. Ideally, AFDD tools should be applied at the initial commissioning phase to ensure that the systems are performing optimally, then it should be applied at the on-going commissioning phase to ensure that they continue to do so.

Figure 1: Here is an overview of fault detection and diagnostics methods and algorithms. Courtesy: Smith Seckman Reid

Figure 2: An example of a terminal box hot water valve hunting issue detected by statistical analysis. Courtesy: Texas A&M Engineering Experiment Station
Fault detection and diagnostic methods
A great diversity of techniques adopted in AFDD tools range from those based on physical and analytical models to those driven by analysis of historical trend data. Figure 1 details the main fault detection and diagnostics methods/algorithms and subcategories based on the comprehensive review of FDD applied to HVAC systems. The following criteria are used to determine the feasibility of FDD methods:
- Embedded into existing systems.
- Proven from field/pilot tests on real buildings.
- Minimize the number of false positives to build user trust in the system.
- Rolled out in a cost-effective manner.
- Generic enough to allow for large-scale implementation that is independent of platform/system.
Although rules-based models may require developing complex or bespoke rules, it is relatively easy to develop and implement an effective rule set as well as expanding the ruleset continuously. Analogously, simplified models may require considerable initial analysis, but they can be used for both system and component level analysis effectively. Conversely, process history-based models require a large amount of data to set up and tend to lack accuracy. Therefore, among all FDD methods, simplified models and rule-based models have the highest potential for market deployment in the short to medium term.
Furthermore, it is proven that an effective combination of FDD methods will improve the accuracy and capability of AFDD. Some data-driven techniques, such as artificial neural networks and statistical hypothesis testing, need to be used in conjunction with physics-based models to improve accuracy; expert systems together with simplified physical models cover a larger range of faults. For example, Figure 2 shows an example of a hot water valve hunting issue detected by statistical analysis.

Figure 3: Here is a snapshot of the Implementer rule creation page where the rule of “supply air static pressure under setpoint” is created using Boolean equations. Courtesy: Texas A&M Engineering Experiment Station
AFDD tools
Today’s market offers dozens of full-featured AFDD tools. According to a study on 14 currently available AFDD tools, most of them use limits, alarms and rule-based algorithms with a combination of first principles. The wide variety of AFDD tools available is also a result of AFDD vendors being flexible to develop various features customized to meet market needs. AFDD tools are mostly web-based or cloud-hosted software, which allows scalability and dynamic upgrades.
The majority of the AFDD tools cover most of the HVAC components and systems including central plants, AHUs and terminal units, and a wide range of faults, such as sensor error, valve hunting, simultaneous heating and cooling, deviation from setpoints, etc. Studies show that the coverage of systems and faults is driven more by building trend data availability than by AFDD product offering Also, while rule-based methodologies are still the norm, vendors are beginning to adopt process history-based techniques.
Take Implementer, an AFDD tool designed by the Energy Systems Laboratory at Texas A&M Engineering Experiment Station to be part of the Continuous Commissioning process, for example. Rules are created to confirm the proper operation of the HVAC systems.
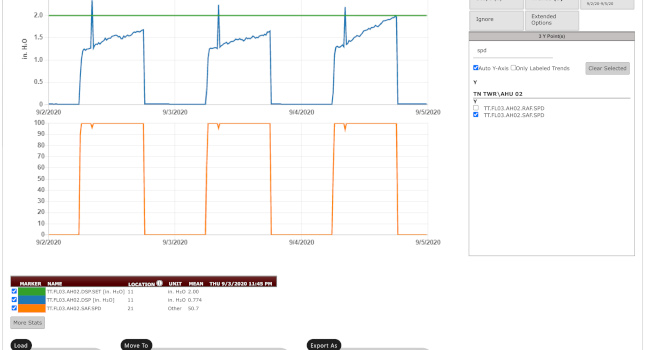
Figure 3 shows that a rule is created to check if supply air static pressure meets its setpoint. Once the FDD rules are executed, the triggered rules are listed separately in the spreadsheet for review. Figure 4 shows the triggered rule of “supply air static pressure under setpoint.” Among the useful hyperlinks available in the AFDD spreadsheet, the time series plot of relevant trends can be used for further analysis. Figure 5 provides a snapshot of the time series plot interface where the users can add/drop various trends and view the plot in different dates.
The costs of AFDD projects are modest compared to capital projects. The Lawrence Berkeley National Laboratory report summarizes the ranges and median of the base cost, annual recurring tool cost and annual labor cost (internal staff or contracted) across 27 organizations using FDD. The median base cost for FDD software installation and configuration was $0.05/square foot and the median annual recurring software cost was $0.02/square foot. The median annual labor cost was $0.05/square foot. A median total cost would be roughly $0.12/square foot for a one-year AFDD service contract and the average annual cost goes down for a multiyear contract.
AFDD tools are commonly delivered with many additional functionalities. Typical features are time series visualization and plotting; quantification of energy impacts and cost management and fault prioritization; and automated work order request system integration, metered data analytics, etc. These supplementary features are “free” and add extra value to AFDD tools.
The Smart Energy Analytics Campaign shows the median savings for participants with AFDD in percentages and dollars per square foot per year. AFDD helped achieve median savings of $0.17 to $0.24 per square foot per year. Comparing the AFDD project cost and savings per square foot, it is evident that using AFDD results in high savings and rapid return on investment, not to mention its noneconomic benefits and additional features.

Figure 4: The rule of “supply air static pressure under setpoint” is triggered because the static pressure is under setpoint during weekdays. Courtesy: Texas A&M Engineering Experiment Station
AFDD project scheme
As Charles E. Gulledge, 2020-2021 ASHRAE president said, “Digital transformation is not simply associated with adopting new technical solutions. Knowledge needs to be captured and linked in such a way that ALL relevant stakeholders’ benefit. Doing so requires understanding of how to collect, store and analyze data; so that it is insightful and actionable.”
It is crucial to use the AFDD tools wisely and effectively. The majority of AFDD tools are configured and used by some combination of facility staff, control vendor, tool vendor and third-party service providers. In most cases, the vendor plus a third party does the configuration, working from owner requirements.
Figure 6 lists a typical AFDD project scheme as part of the fault management workflow. Firstly, an AFDD user should collect interval historical HVAC system trend data from the BAS, local to the equipment or controller, external sensors and meters or a combination of these data sources.
Second, the user should set up the AFDD portal based on the trends and HVAC system configurations, which can be obtained from BAS and mechanical drawings. Some of the AFDD tools may require additional setup depending on the adopted FDD methods.
For example, for AFDD tool rule-based models, a library of existing rules may be offered by the AFDD tool provider and the user may also need to create bespoke rules specific to the HVAC systems and the sequences of operation. Once the AFDD setup is completed, the user will be able to run AFDD to output faults and diagnoses. The process generally relies on analytical or physical redundancies to isolate faults during the diagnostic step.
Lastly, the user can evaluate the faults and the possible causes and validate the issues considering multiple factors including energy efficiency, economic loss, comfort impediment, safety concerns or environmental impact.
The validated issues should be listed based on their relative significance and prioritized to focus effort where most valuable. This ensures that over-stretched maintenance resources are used in the most beneficial and cost-effective manner.
Trend data collection surprisingly presents the most challenges in the entire AFDD project. Typically, the AFDD user provides the list “format” of the trend data to the control vendor and the control vendor creates daily trends through the BAS. Here are some common issues and solutions.
- Most modern BAS platforms can send scheduled emails that contain trend reports to the AFDD portal. However, many facilities are regulated with high-security precautions on both the BAS and the local computer and ban email communications. Multiple methods have been developed to import the trend data into the AFDD portal through the FTP site, HTTPS POST, API script, etc.
- Trending all available BAS points may cause long processing time and low memory space on the field panels, while trending insufficient points may hinder the AFDD tool capacities. A general rule of thumb is to trend all critical control points for HVAC equipment such as chillers, boilers, AHUs, pumps, etc. with a data interval of 5 to 30 minutes. Also, breaking down big trend files generated by the BAS can reduce the BAS processing time.
- Different BAS platforms may export completely different trend file formats including XLSX, XLS, CSV, TSV, etc. Current AFDD tools are capable of dealing with most data formats. In case where a new data format cannot be read, AFDD tool providers should be able to either add a separate file-based reader or modify the data to fit the tool.
- It is not uncommon for a building expansion, server migration or BAS upgrade to occur and extra effort is required for setup. Unfortunately, there is no way around this. It is recommended to plan accordingly for a smooth transition and make sure that the trend point names remain the same so that the original AFDD portal setup remains validated.
- Some small facilities cannot generate automatic trend reports or do not have BAS or energy management staff and present much tighter payback constraints due to smaller energy expenditures. The frequency of generating trend reports manually should be lowered as well as delivering AFDD issues reports based on the project budget.
It is worth pointing out that most AFDD tools focus on fault detection but still require a significant level of user knowledge and experience to avoid false-positive faults and validate issues. This knowledge and experience may not always be available in-house, further compelling the expansion of market delivery of AFDD through third-party service providers.
As part of the consulting service, the third-party service providers deliver AFDD issue reports periodically, such as biweekly, monthly or quarterly, as well as troubleshooting specific issues remotely through trends, estimating energy and cost savings and performing optional on-site assessments.

Figure 5: A time series plot of relevant trends in the triggered issue is available for further analysis. Courtesy: Texas A&M Engineering Experiment Station
AFDD benchmark
When considering which AFDD tool to use or how well a particular tool works, end-users need to be able to benchmark the performance of AFDD. There has been some research about measuring or evaluating the performance of FDD technologies applied in HVAC systems.
However, the process requires manual inputs and needs automation of key steps to improve scalability and repeatability. More importantly, the current dataset input needs to be further expanded toward widespread adoption.
Unfortunately, there are currently no available standards to support the methodology or provide datasets for an AFDD performance benchmark. With the aforementioned methodology being further developed, the users will make informed selections, AFDD tool vendors will further improve the measurable performance and accuracy and regulatory bodies will be able to integrate AFDD to guidelines, standards or technology certifications.

Figure 6: A typical automated fault detection and diagnostics project scheme consists of four basic steps. Courtesy: Smith Seckman Reid
Challenges down the road
Unlike the measurement and verification process that is well-developed to determine the overall building energy performance based on the National Renewable Energy Laboratory’s International Performance Measurement and Verification Protocol, AFDD is still in the relatively early stage of adoption nationwide — it is a powerful aid to ensure optimal operational performance. The following barriers are down the road and must be addressed before widespread adoption.
- Information technology and data integration represent one of the largest barriers to scale. Data integration and management need improvements.
- AFDD tools require a significant amount of time for initial setup, which has the effect of significantly increasing the labor and overall cost of AFDD projects. The autonomy of the initial setup should be largely enhanced to minimize the manual effort.
- Currently, AFDD mostly serves as an independent input to energy management practices, such as strategic energy management and monitoring-based commissioning. Ideally, AFDD should be integrated within various commissioning phases.
- There is a lack of standardization of how to evaluate the fault categories, the diagnostic messages and the FDD technical capabilities. Such standardization would require buy-in and agreement from a broad group of developers, vendors and users (both facility staff and third-party service providers).
- Neither widely accepted AFDD evaluation methodologies nor standards/codes addressing AFDD exist. Joint efforts of the entire AFDD community should be spent to formalize the current validated methodology into guidelines or standards.
As the world embraces the new remote norm beyond the COVID-19 crisis, being able to remotely access, visualize and analyze building data becomes an increasingly essential part of remote building management. AFDD is the future.
Do you have experience and expertise with the topics mentioned in this content? You should consider contributing to our CFE Media editorial team and getting the recognition you and your company deserve. Click here to start this process.
