Consider the impact of infiltration and building pressurization on air systems in an office building
The effect of infiltration and building pressurization on air handling system sizing and design can be best conveyed through a case study. Consider a nine-story, 270,000-square-foot office building located in Washington, D.C., a climate with hot and humid summers and cold winters. Each floor is modeled identically and primarily consists of office and conference space. Occupancy rates are based on the 2018 edition of the International Mechanical Code default occupancy rates.
The building is conditioned with a dedicated outside air system and radiant ceiling panel type system, in which the outside air provided by the DOAS must handle all latent loads due to occupants and infiltration. The design supply air dewpoint is 47°F. Building entrances and exits on the first floor are not included in the analysis.
The outside airflow to each zone is determined based on the worst case of the ventilation and latent load requirement. The latent load associated with infiltration will peak at the perfect combination of wind speed, wind direction and outside air dewpoint. Fortunately, swampy, humid weather and high winds speeds do not often coincide. Due to this relationship, latent infiltration is best expressed using a metric called latent Btuh per square foot of exterior wall area.
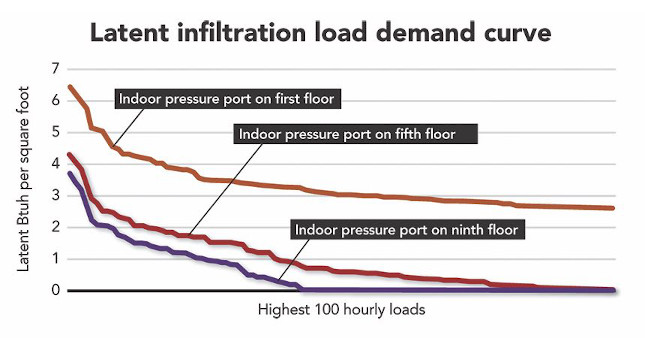
Using the infiltration calculation procedure in ASHRAE Handbook – Fundamentals combined with a full year of weather data, one can calculate the latent infiltration load for each hour of the year, then sort highest to lowest and plot the data to generate a latent Btuh per square foot of exterior wall area demand curve for each level and each façade of a building.
The designer can then choose a point on the curve deemed most appropriate for the application. An example is shown in Figure 5, which includes three demand curves for ninth floor rooms on the west side of the building to illustrate the potential impact of the indoor pressure port location. The data are based on a differential pressure setpoint of -0.025 inches w.c.
Figure 5 indicates that placing the indoor pressure port on the ninth floor will result in a significant reduction in latent infiltration assuming a fixed DP setpoint. It does so by providing increased mechanical pressurization leading to increased exfiltration on lower levels and through nonwindward walls, thus reducing the relief/exhaust airflow available for energy recovery.
The takeaway from this comparison is that indoor pressure port location and DP setpoint have a significant impact on where buildings experience peak loads. Strategies that result in a highly pressurized building will lead to reduced peak room level loads due to the prevention of infiltration, but will cause increased outside air loads at the DOAS unit due to the reduced volume of relief air available for energy recovery. The reverse will occur for buildings without significant mechanical pressurization. An understanding of this relationship is necessary for the optimal sizing of air handling systems.
The latent infiltration design day procedure was applied to the building. The analysis assumed an average mechanical pressurization of -0.025 inches w.c. (I.e., the effect of the indoor pressure port location was omitted) and average envelope construction. The resulting peak outdoor airflow rates are shown in Table 3 without any diversity applied.
The upper floors experience significantly higher latent infiltration rates and as a result, require significantly more outside air than lower floors even though they have the same internal occupancy and layout. The higher infiltration rates are driven by summer stack effect and the higher wind speeds experienced by upper floors.
The LIDD approach differs from the standard industry practice of computerized load calculations. Computerized load calculation tools typically require the user to enter/guess an infiltration airflow rate in the unit of their choosing (I.e., cubic feet per minute per square feet of wall, air changes per hour, etc.). The simulation then uses the entered rate and whatever the outdoor air conditions happen to be at the room sensible or total peak load condition to determine latent infiltration load.
In a typical computerized load simulation, the impact of stack effect and mechanical pressurization cannot be automatically accounted for. If the room peaks occur during a shoulder season, the load calculation tool may even report the peak latent infiltration loads as a negative value. For the design of air handling systems in which humidity control is important, the LIDD approach can provide potentially more accurate latent infiltration load estimates than computerized load calculation tools or can be used to inform the inputs to computerized load calculation tools.