When designers understand basic concepts applied within air movement or air handling systems and make correct fan selections, these systems can operate at or near peak efficiency
Learning Objectives
- Know the codes and standards that guide air handling system design and specification.
- Understand basic information for selecting fans to meet air movement system requirements.
- Determine fan size and design operating point.
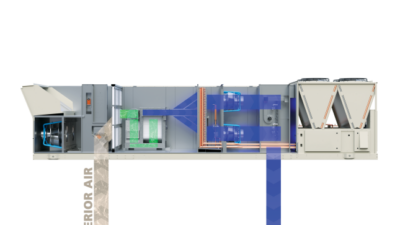
A fan is required in typical heating, ventilation and air conditioning systems where air is exhausted, distributed and circulated for a variety of different building or facility load requirements such as for heating and cooling or for ventilation needs. A fan uses a power-driven rotating impeller within the definition by ASHRAE to move and handle air.![]()
There are a number of different fans manufactured that can be used for any of a wide variety of applications. Chapter 21 of ASHRAE’s 2020 HVAC Systems and Equipment Handbook covers fans. Fans are generally categorized in two big groups, centrifugal fans and axial fans. Figures 1 and 2 in this ASHRAE chapter show both a centrifugal fan and an axial flow fan, respectively.
Within these two groups are several subgroups, as illustrated in Table 1 and include forward curved, backward inclined and plenum/plug fans (often used in air handling unit fan arrays) within the centrifugal family. Simple propeller fans used in many garages, as well as tubeaxials, vaneaxials and mixed-flow fans are included in the axial family.
Based upon a specific application — such as exhausting potentially flammable or explosive vapors or local, state and federal codes and regulations — it may dictate requirements that target the types of fans selected for use within the design of an air moving system. More likely, however, the air moving system itself will be scrutinized in relation to ease of application, space constraints, energy efficiency, indoor air quality, acoustics or other requirements.
ASHRAE is a good technical resource for all designers and within four different handbooks, there is an entire chapter dedicated to listing “codes and standards.” This chapter also references other publications representing common practices, methods and useful guides relevant to practicing engineers.
Organizations such as ASHRAE have standards that many codes have adopted such as ASHRAE Standard 90.1: Energy Standard for Buildings Except Low-Rise Residential Buildings and ASHRAE Standard 62.1: Ventilation for Acceptable Indoor Air Quality. Within Standard 90.1, the designer will find minimum efficiency requirements for HVAC systems in Chapter 6 that will affect fan systems.
The Air Movement and Control Association International, or AMCA, provides helpful publications and standards to expand a user’s understanding of air moving systems such as AMCA Publication 201-02 (R2011)|Fans and Systems or ANSI/AMCA Standard 208-18|Calculation of the Fan Energy Index.
Most fans bear an AMCA Certified seal, which means the fan manufacturer followed the ANSI/AMCA Standard 210-16/ASHRAE 51-16 – Laboratory Methods of Testing Fans for Certified Aerodynamic Performance Rating test procedures and tested the fan in one of four standardized AMCA Installation types: A, B, C and D (see Figure 1). The major fan manufacturers have additional information available as well.

Understanding static, velocity and total pressure in air movement
Static pressure (SP or Ps): Static pressure is defined in fluid dynamics as the pressure exerted by a gas or liquid that is not moving. Think of a tight-fitting piston in the center section of a cylinder with its top open to air. There is a pressure measuring device in the bottom half of the cylinder reading zero pressure so the pressure below the piston is equal to the barometric pressure above. If the piston moves downward, the air below is compressed and the pressure device will read a positive static pressure relative to atmospheric pressure. If the piston moves upward, the air below expands and the pressure device will read a negative static pressure relative to atmospheric. In either case, the air pressure above or below the piston has the potential to expand back or contract back to its original volume, respectively. This illustrates both positive and negative static pressure in stationary air.
Velocity pressure (VP or Pv): Velocity pressure is created by the movement of the air itself. It increases as velocity increases and decreases as velocity decreases. It is always positive, only exerted in the direction of airflow and is a function of air density. Velocity pressure is that pressure required to accelerate air from zero velocity (V0) to some other velocity (V1) and is proportional to the kinetic energy of the air stream.
If you stick your hand up with the palm out of a car window when driving down the road, your hand will be pushed backward. This is because the pressure in front of your hand is higher than the pressure behind your hand. You are causing a pressure differential front to back on your hand and the faster the car goes, the more force will be pushing back on your hand because the air’s velocity pressure will be higher. Driving faster does not increase the static pressure as it is the same pressure, by definition, as if you were not moving.
Total pressure (TP or Pt): Total pressure is the sum of both the static pressures plus the velocity pressures of all the elements in a system.
TP=SP+VP or Pt= Ps +Pv
Some people are not clear about total pressure and only include the sum of the static pressure elements in a system, calling this the total pressure drop. But in using total pressure curves you must always add the velocity pressures to the static pressures.
With your hand out of the car window above, the measured pressure in front of your hand is actually the total pressure. Velocity pressure cannot be measured directly. The pressure behind your hand would be the static pressure. The difference between TP and SP would be the VP.
Flow velocities of air inside ductwork are determined by measuring the velocity pressures in the duct with a pitot tube assembly connected to a differential pressure sensor. The pitot tube assembly is pulled across the diameter of the ductwork in what is called a traverse to obtain an average reading throughout. This is because the maximum air velocity will be at the center of the duct while it will be much less and approaching zero at the sidewalls.
The pitot tube assembly includes a static pressure probe and a total pressure probe. The total pressure probe is aligned into the airflow and senses the total pressure (duct velocity pressure and static pressure together), while the static pressure probe is aligned at a right angle to airflow and senses only static pressure. The difference between total and static pressure readings is the velocity pressure.
With the velocity V and the air density d (lbm/ft3) the velocity pressure VP can be calculated by the first equation that follows. For standard air density of d = 0.076 lbm/ft3, the second equation applies.
VP=d(V/1096.2)^2 ; VP=(V/4005)^2
The difference between total and static pressure may be negligible in some applications, but not knowing and neglecting the difference in other applications may cause unintentional and costly mistakes.

Define and understand the system application
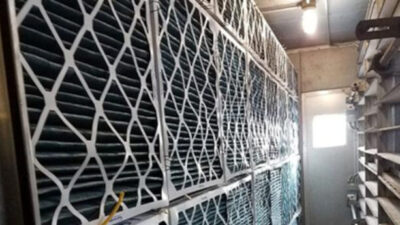
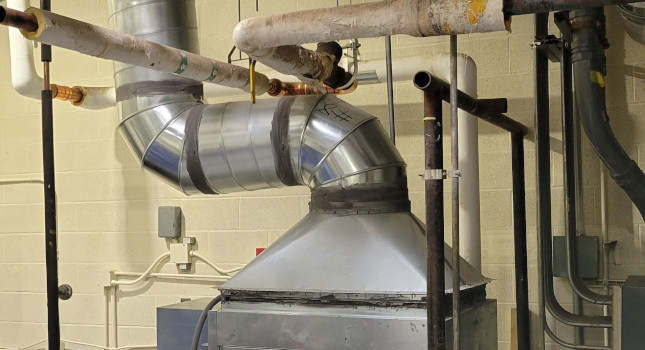
The fan in HVAC systems overcomes all the component resistances (ductwork and fittings, dampers, air filters and heating or cooling coils) to the air movement by creating negative or positive pressures in the system. The air may need to be delivered or transferred over relatively long distances. If in systems with higher temperatures or at locations with higher elevations, a designer should consider all the air’s specific properties, such as density. The air’s properties could be quite different from at standard conditions and the designer should correct to actual cubic feet per minute (ACFM) and not use standard cfm (SCFM) for the fan performance.
The actual fan installation will also affect the fan’s overall operation and must be considered in its selection. This installation effect is commonly referred to as system effect in the air moving industry and simply results from the difference in how the fan was tested, as defined and cataloged by AMCA, compared to how it is installed. One example would be if a 90-degree elbow is installed directly into the fan inlet. This is not a standardized installation type as indicated in Figure 1. This article will not be covering the topic of system effect, but the designer is encouraged to investigate how this should be considered in selecting fans.
Determining this resistance to flow or pressure drop in a new or existing HVAC system is an important design task to be completed. This pressure drop is referred to as the total pressure loss; for English units, is usually expressed in inches of water column abbreviated by inches w.c., inches w.g. or inches H2O. The main key to understanding and interpreting total pressures is to first understand how pressures change throughout an HVAC system.
Air movement/handling and fan selection
As mentioned, the air distribution in a system can be on the positive on the supply side or negative on the return or exhaust side of the building’s system. The process of selecting and sizing the fans includes steps that a designer needs to take to complete his/her task for an installation. The concepts to consider for a particular design task and the designer’s experience level will determine the complexity of the overall process.
Based upon configuration and the direction of airflow through its impeller, all fans manipulate a combination of an airflow’s velocity vectors either tangentially, radially or axially to produce the pressures necessary to move the air stream. The design of a fan’s impeller blades (radial, backward inclined flat or airfoil, forward curved, etc.) and its housing (single or double inlet scroll, housing or plenum chamber, etc.) will dictate the available pressure increases and efficiencies for any specific application.
The majority of designers use a computer program such as VariTrane Duct Designer to perform some type of pressure loss modeling of the air distribution system to calculate the pressure losses. Calculating pressure losses through a duct system can be done easily enough with a computerized program or even an automated spreadsheet using the concept of equivalent lengths of ductwork and determining the pressure loss per 100 feet of duct.
The methods are similar to completing piping friction loss calculations. The designer will need to look up equivalent lengths for all the fittings based on the type selected or have the program select it for them. The loss from each duct segment is summed and compared to other segments with the largest one selected then a safety factor may be applied. This static pressure loss is then added to all other system component losses (coils, dampers, filters) that have been calculated or provided by equipment selections and used to select the fan for the system.
These loss calculations, however done, should be completed for any design as they will assist in the selection of all component equipment (fans, filters, coils) as well as the pressure class of the distribution ductwork, fittings and dampers within the system. The calculation process is iterative, especially for a newly designed system. An existing system being modified might require several modeling runs as well but may require only a few changes to fully integrate the system to the modified use. The main point to remember is that every component within the system will affect the pressure and the air flow rate and will either keep the pressure at a particular level, increase the pressure or decrease the pressure.


Fan performance tables, curves, sizes and design operating point
After the preliminary steps of configuring an air handling system layout and calculating the total static pressure loss are complete, the designer needs to select the fan. To select the fan performance, the designer needs to provide the flow rate in cubic feet per minute and total developed pressure loss in inches of w.g.
For a given project’s needs, fan performance tables and fan curves can be provided for any specific manufacturer’s fan. Performance tables (Table 1) can be used for an initial selection of a fan and are typically arranged by rows and columns providing information such as flowrates in cubic feet per minute, speeds in revolutions per minute, static pressures in inches of w.g., motor horsepower and perhaps sound information.
To use a table, just find the required cubic feet per minute on the left vertical side (say, 900 cfm) and move to the right horizontally to the required static pressure column (say, 1-inch w.g.). At this point you can read both the fan rpm and the brake horsepower, or bhp (1,449 rpm and 0.30 bhp). Note that with this table, this manufacturer indicates the performance is a Type B, free inlet with ducted outlet.
Per AMCA, under the cataloged performance for any fan model, the manufacturer must state how the fan was tested such as: “Performance shown is for Installation Type B, free inlet, ducted outlet.” Additional statements may be included indicating that drive losses are not included in brake horsepower rating. In short, the fan manufacturers can only guarantee the fan’s performance as tested and it is up to the designer to ensure there are no unintended obstructions near the fan that will add to the established system friction losses or pressure drops.

Fan curves are more common to illustrate a range of difference fans’ performances or a single fan’s performance, as a quick snapshot. These curves also show flowrates, static pressures and a family of rpm speed and motor horsepower curves to help in fully understanding how a fan might operate in the system. Using these curves, a designer would locate the desired flowrate in cfm along the horizontal x-axis, with the corresponding static pressures (inches w.g.) along the vertical y-axis. At the intersection point, the required motor size and rpm would be identified.
There are several reasons to consider a good selection point for a fan application. The steepness of the curve will provide some immediate feedback to the designer. A steeper curve allows for relatively larger changes in pressure drop with a smaller effect on desired flow. A flatter curve will allow a small change in pressure drop to produce a relatively larger change in flow. Note that there is a dashed line on the left past which the fan should not operate. This is sometimes called the stall point.