Owners and operators can leverage data within their building control systems to optimize systems, identify problems and monitor building performance.

Learning Objectives
- Understand how building control system data is obtained and trended.
- Consider what types of data are used and how each is selected.
- Review examples of how data can be leveraged for maintaining, troubleshooting and optimizing systems.
Building control insights
- Building control systems are essential for collecting, storing and analyzing data from various building equipment, enabling operators to optimize performance, detect inefficiencies and make informed decisions that improve overall facility operations.
- By integrating systems during design and leveraging trend data for continuous monitoring, building controls play a crucial role in ensuring energy efficiency, regulatory compliance and long-term operational success.
In a data-driven world, harnessing information is essential for enhancing a building’s efficiency and performance. Fortunately, most modern control systems integrate with various building systems and equipment to collect data about status and performance. What happens with the data and how it is used is less clear.
Owners and operators spend most of their time on maintenance activities that keep the building running smoothly, leaving them with little time to analyze the data within their building control system, let alone devise new ways to use the information. However, leveraging this data can provide valuable insight into potential problems and performance issues, leading to improved decision-making, optimized systems and cost savings.
Gathering info for the building control system
Before understanding how building system data can be used, engineers need to know how data is gathered from the equipment integrated with the system. Buildings consist of many different systems and pieces of equipment, which are often hardwired directly to instrumentation or configured through a communication data link to pull data directly from the equipment or packaged systems (see Figure 1).
Equipment integration typically is defined during the design phase. Engineers will investigate available communication protocols or output signals and specify how the control system will read the data. Common protocols for building automation systems (BAS) include BACnet and Modbus, with BACnet being the most widely used.
Once the communication protocol is defined, the list of points to be mapped into the control system needs to be identified. This involves reviewing BACnet object or Modbus register lists and selecting the desired points. The points mapped will vary depending on the type of equipment and the intended use of the data. BAS software will commonly auto-discover all available BACnet objects. However, it is recommended that only desired points are mapped.
To illustrate, when gathering data to monitor and track building energy efficiency, points are often mapped from electric meters and hydronic system flow computers, also known as Btu meters. Points such as power (kilowatts), energy used (kilowatt-hour), power factor, voltage, current and peak demand, if available, are typically mapped from electric meters. Similar energy consumption data, such as energy rate and energy total, can be pulled from Btu meters rather than calculating these values with the BAS.
Equipment integrations are often used for operations and maintenance purposes. Large equipment, such as chillers and boilers, is often equipped with communication cards to facilitate integration with a BAS. Points may be selected to gain insight into how the machine is operating in real-time, as well as pull data for trending and archiving.
Specifically, internal chiller points can be mapped to the BAS and added to a graphic to duplicate the local equipment human-machine interface. This allows operations personnel to view more than just the water temperature entering and leaving the machine, gaining insight into how it is truly performing.
Setting up trends for data collection, analysis
After a communication link is established, desired points are identified and the control system software is configured, trends need to be set up to save the data. Trends can be configured as interval trends or change of value (COV) trends. Interval trends are typically used for analog points that are continually changing, such as flow rate, temperature or energy rate, with data points collected at established sample intervals.
For example, a trend with a sample interval of 10 minutes would save a data point every 10 minutes. Determining the sample interval is a balance between gathering as many data points as possible to obtain an accurate representation of the system’s operating performance without missing data, versus collecting excessive data that could degrade performance of master-slave/token passing-based networks or duplicate points due to unchanged values. The impact of trend data collection on network performance is less of a concern with internet protocol (IP)-based control systems, which are common in modern control systems.

Change of value trends save a data point based on deviation from a set threshold for analog points and change of state for discrete points. COV trends can be used for analog points that operate at steady state or change very slowly. For example, a COV trend that sets a threshold of 1°F would only save a data point when the temperature changes by more than 1°F from the last sample.
This can be useful when trying to minimize the amount of trend data. However, cycling or instability can be missed if the thresholds are too large. This is not the case for discrete points that only have two states (e.g., on and off). A COV trend on a discrete point will save a data point any time there’s a change. Because there are only two states, there is no risk of missing data.
That said, trend files in modern BASs are very small compared to other applications and files. Therefore, the need to minimize the amount of collected data for data storage availability and affordability should be weighed against the value of gathering data at consistent sample intervals. Ensuring that trend reports are set to the same data recording intervals allows for a more accurate analysis of system performance.
As the system collects a large amount of trend data, it must be stored somewhere. Control systems typically handle this by saving the most recent data locally in the supervisory controller that directly connects to or communicates with the end device. After a predetermined amount of time or number of samples, the data is then sent to a server for long-term storage. This server can run on the same software platform as the control system or be a third-party data historian. A separate data historian is a good choice when trend data from multiple systems need to be stored and viewed in the same location.
Continuous improvement with building control systems
Building control systems data is essential for maintaining the highest level of efficiency and meeting regulatory standards in complex built environments. Collecting and analyzing data from various building systems enables owners and operators to monitor usage, understand maintenance needs and identify system anomalies, helping them to make informed decisions that streamline operations and lead to continuous improvement.
Maintaining heating and cooling systems
A BAS can track the performance of boilers, chillers and other heating and cooling equipment, providing historical and real-time data that can be used for ongoing monitoring and proactive maintenance. Using this data, malfunctions or inefficiencies can be detected early, allowing for adjustments and optimization that improve reliability, efficiency and longevity and prevent serious breakdowns that can incur expensive repairs.
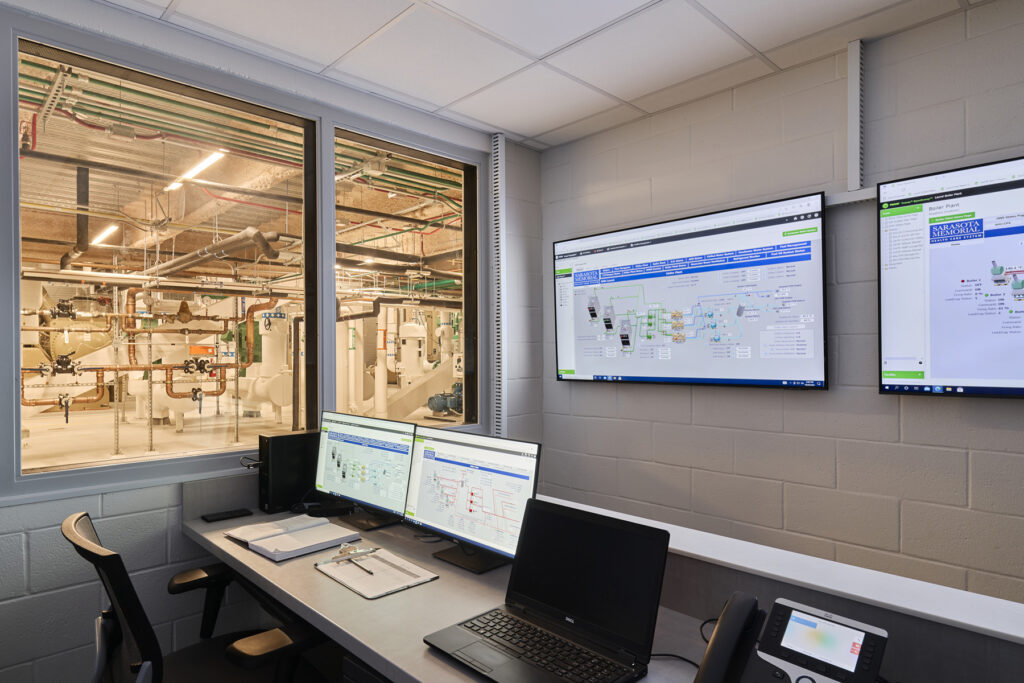
One practical application of this data is in detecting issues within heating, ventilation and air conditioning (HVAC) systems, which can significantly improve efficiency and building comfort. In one case, the building engineer of a biotech research and development lab used data from the building control system to troubleshoot problems with a six-pipe heat recovery chiller, which was not staging the modules and compressors as expected. They used the data mapped from a BACnet integration to pull real-time operating data and create a graphical display for each chiller module, including module status (heating or cooling), inlet and outlet temperatures, compressor status, module runtime and internal valve positions.
The display (see Figure 2) allowed the team to easily assess system performance and pinpoint that the individual chiller modules were not operating at full capacity. The heat recovery chiller was adding heat to the chilled water system. This led to a field visit from the chiller service technician, who confirmed that the three-way control valves within the chiller were allowing warm water to flow through, thereby degrading the cooling performance.
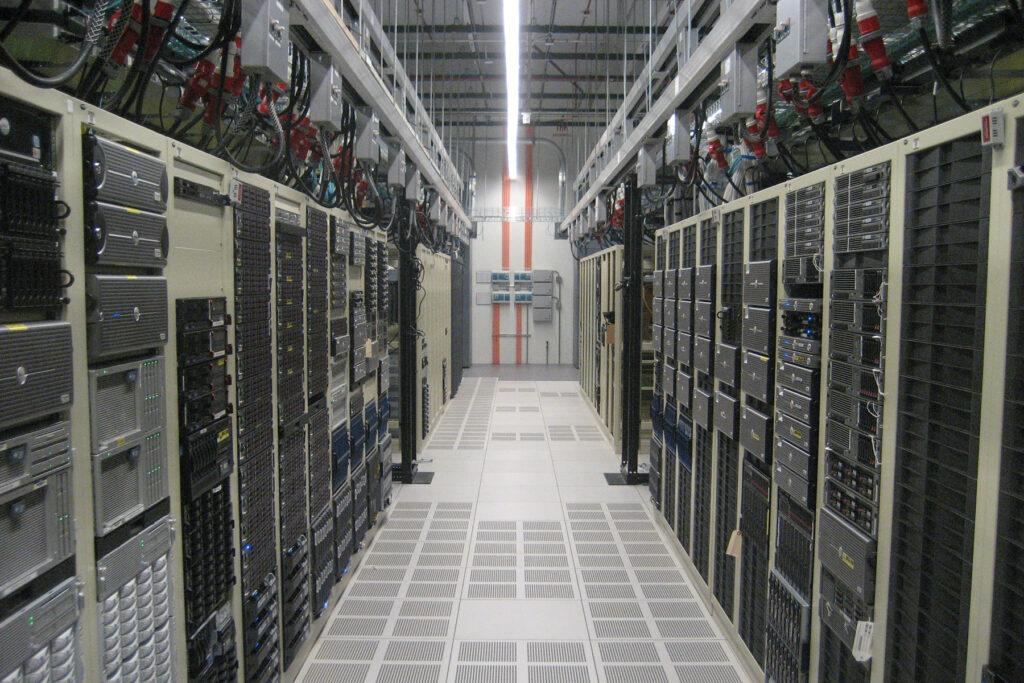
In the context of high-tech environments, data can play a vital role in assessing cooling efficiency and optimizing temperatures, which is crucial for protecting high-performance computing equipment. Specifically, one large data center used energy data gathered from the BAS by way of the electrical power monitoring system to determine cooling load and as a type of feed-forward to the chilled water system (staging for chillers).
The colocation space energy usage data in kilowatts is pulled from various devices, such as electrical switchgear, meters, uninterruptible power supplies and mechanical equipment control panels via Modbus or BACnet datalinks. The information technology kilowatt data is then converted to an equivalent tonnage (cooling load), which was compared to the design capacity for operating chillers. Based on this comparison, the quantity of chillers operating is then staged up or down. This allows the system to maintain a more stable chilled water system temperature by starting or stopping equipment before the system temperature deviates from the setpoint (see Figure 3).
Optimizing energy consumption and improving building performance
Owners and managers can use data to pinpoint specific areas or systems that exhibit unusually high energy usage and identify recurring anomalies, patterns and events that impact energy consumption. This can aid in implementing corrective actions to control settings and ensure timely equipment maintenance, thereby preventing further energy waste and minimizing potential damage.
For example, after comparing energy use data from the BAS with its utility bills, a research facility identified a discrepancy that led to the discovery of a faulty electric meter and the issue was promptly corrected.
Energy usage data is also helpful for improving building performance. Data can be compared against established standards, best practices or similar structures to better understand a building’s current energy usage and forecast future energy consumption. It enables the identification of areas where performance lags established benchmarks, thereby highlighting opportunities to improve operational efficiency and reliability and reduce environmental impact. For example, actual airflow or chilled water system energy rate data can be compared to the building energy model to determine whether the building is operating as expected and modeled.
In another instance, a facility focused on reducing air pollution uses data from the BAS to proactively identify HVAC system inefficiencies. The BAS feeds data into the building’s fault detection and diagnostics (FDD) software, which continuously monitors its network of mechanical, electrical and plumbing systems. The software then analyzes operational data streams and compares them to predetermined baseline/normal conditions to identify anomalies that could negatively impact building performance.
Instead of waiting for equipment failures or occupant complaints, the system flags deviations from optimal or normal conditions. This early detection notifies the facility operations team to address issues promptly, ensuring the building consistently operates at its peak efficiency and avoids forcing the facility team to operate in a reactive mode.
An important step in this process is establishing the baseline or normal, conditions against which the software will compare real-time data. This can be accomplished in a few ways. FDD software packages include pre-defined faults that can be selected and used. Faults can also be configured in the BAS using the faults defined in ASHRAE Guideline 36: High Performance Sequences of Operation for HVAC Systems. It’s worth noting that implementing fault detection and diagnostics is required as of International Energy Conservation Code 2021.
The data generated post-construction has proven invaluable for the facility engineering team, closing the loop between design and actual building performance. Real-world operational data is used to verify the building’s performance against the initial design specifications. This data-driven approach enables a precise assessment of whether the energy models and sustainability strategies implemented during the design phase translate into tangible results. By analyzing energy consumption trends at an individual system level, along with renewable energy generation and system efficiencies, facility engineers can identify areas where performance aligns with expectations and pinpoint any discrepancies that require fine-tuning or optimization.
Ensuring regulatory compliance and showcasing success
Regulatory standards play a crucial role in ensuring that buildings and their equipment meet specified performance levels. Governments and industry organizations establish these standards to foster safety, comfort, sustainability, energy efficiency and overall quality in buildings. Building and process control systems are crucial for compiling and tracking performance data to ensure compliance with standards such as FDA CFR 21 Part 11 and facilitate regular audits.
To comply with regulations, a health care diagnostics company uses temperature and humidity sensors as well as wireless data loggers to share environmental data — such as freezer temperatures — with a server-based data historian. All temperature readings are recorded in the data historian, along with temperature and humidity readings for the locations where the samples are stored (e.g., warehouses, refrigerators and freezers). The data loggers send data to the historian server via wireless long-range wide-area network (LoRaWAN) communication to a gateway device, which is connected to the data historian network via Ethernet/IP.
Each field device is configured with an input type, communication settings and sampling rates to get the temperature sensor data to the gateway, which is configured for both sides of the communication. One side is for LoRaWAN (data loggers) and one side is for Ethernet/IP (historian). Once the data has been passed through the gateway and to the historian layer, the data is displayed on graphics and stored in a historian for CFR 21 compliance.
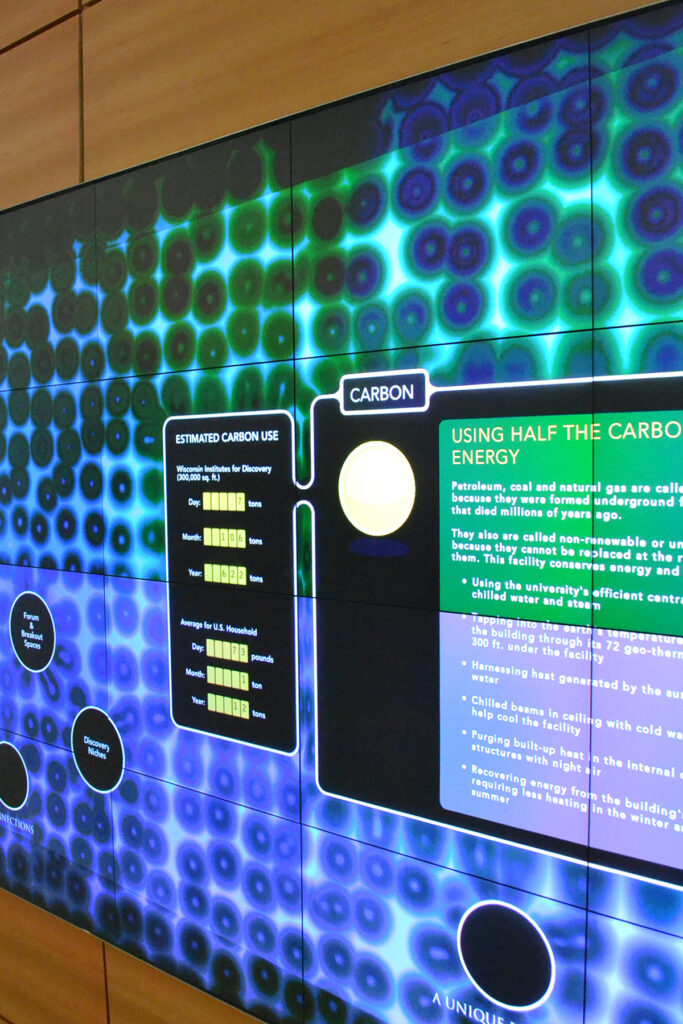
Additionally, building systems’ data is useful for self-reporting within companies and for sharing successes with the public. To showcase the building’s net-zero energy performance, the previously mentioned air pollution reduction facility displays real-time key performance indicators on a public kiosk, providing a living dashboard for the public to enjoy. The kiosk displays data on solar energy generation, low energy usage or carbon emissions compared to similar buildings. These metrics foster transparency, educate stakeholders and cultivate a sense of pride and collective responsibility in achieving sustainability goals (see Figure 4).
Tracking chain of custody
Building control systems can play a significant role in tracking the location of an item within a building. This can be crucial in ensuring the integrity and efficiency of testing within a lab or manufacturing facility.
For instance, a facility that tests vehicle emissions relies on up to five of the building’s various control and data acquisition systems to accurately track a vehicle and its data throughout the facility. As a vehicle is moved through the building for testing, the vehicle location is scanned and data is collected (e.g., tire pressure, mileage, fuel levels) in each space (e.g., soak space, fueling room, test cell). This data is further communicated to the lab management system (LMS).
The integrity of the data ultimately depends on the building’s control systems and the communication between them. If the chain of custody is broken or communication between these systems is lost for even a moment, the LMS will deem the test failed. This could result in the loss of weeks of test data.
Better managed buildings rely on accurate building control data
Control system data can be leveraged in numerous ways to help facility operations teams manage their buildings better. One final consideration is the importance of having reliable data. Whether it is used for equipment staging to ensure the system operates efficiently, displaying data on a public kiosk or dashboard or for validation purposes, these applications will not be successful if data is inaccurate or not processed and saved correctly.
Obtaining reliable data requires identifying which systems will be integrated into the BAS and which points will be monitored during the design phase. Carefully considering how to properly configure trends and where to save data is also key. If the information is thoughtfully laid out in BAS graphics and can be easily manipulated for analysis, it can provide valuable insights into how building systems are operating and pay dividends throughout the building’s life.