A biotechnology company in Wisconsin used its building control system to collect and analyze electric and water meter data, enabling it to detect metering errors, establish reliable energy baselines and identify opportunities for improved efficiency and utility cost savings.

BAS insights
- The building automation system (BAS) enabled a biotechnology company in Wisconsin to monitor and trend detailed energy usage data across key load categories, helping identify a faulty electric meter and validate utility billing accuracy.
- By using the BAS to establish consistent baselines and uncover metering discrepancies, the facility now continuously improves operational efficiency and resource management.
Tracking energy usage is crucial for gaining valuable insights into consumption patterns. Building automation systems (BAS) can significantly contribute to this process by automating data collection, enabling facility managers to identify inefficiencies, troubleshoot issues and ultimately optimize their energy use.
A biotechnology company in southern Wisconsin used the data collected from the BAS in its new research facility to track energy use trends over an extended period. The building’s electrical system categorizes loads into four main groups, as required by International Energy Conservation Code and ASHRAE Standard 90.1: Energy Standard for Buildings Except Low-Rise Residential Buildings: mechanical loads, plug loads, UPS loads and lighting.
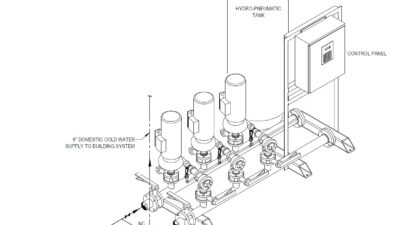
The building’s power consumption is metered by the local utility, which can typically provide data at 15-minute intervals. Therefore, submeters were installed to measure and obtain detailed trends for each of the load categories, enabling facility engineers to take a deeper dive into the data.
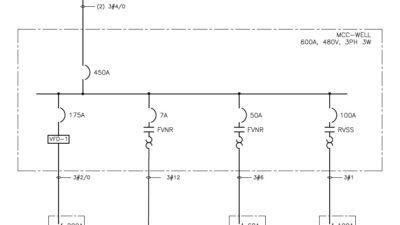
The BAS is integrated with the building’s electric meters and communicates via BACnet/internet protocol to a gateway that communicates with the individual meters in the electrical gear. The BACnet object list for each type of meter was reviewed and the required points were selected and mapped to the BAS. Energy consumption (kilowatt-hours) points were totalized monthly by the BAS and trends were configured to save two years of monthly data.
It is important to note that trend samples must be saved before monthly totalization points are reset for the next month. When totalization points aren’t trended correctly or don’t roll over correctly, the monthly data can be lost or incorrect due to simple calculation errors. This happened several times at this facility but was able to be corrected because it was noticed quickly.
Power monitoring summary graphics were created on the BAS, one displaying real-time energy usage and the other displaying monthly energy consumption. The energy usage for each load type for the current and previous months is displayed on the graphic for quick comparison.
After several years of collecting and storing information in the BAS, the data, which has proven to be consistent and reliable, is now being used to investigate large changes in energy usage from one month to the next.
In one case, by comparing the BAS data to the information on utility bills, the facility engineer determined that a faulty electric meter was responsible for the monthly energy consumption being significantly lower than the amount indicated on the utility bills. This issue was promptly corrected.
The consistent, month-to-month electric meter data has given the facility engineer confidence to use it as a baseline to look for additional ways to save energy. Particularly, if equipment schedules are adjusted to turn equipment off for longer durations, the energy usage data will indicate whether this change has a lasting impact over time. It can also indicate a problem if energy usage increases without changes being made.
Furthermore, the effective use of BAS electric meter data for monitoring energy consumption has prompted the facility engineer to employ similar data analysis techniques to evaluate the building’s water meter readings against its utility bills. After investigating why the water utility bills were higher than the meter readings, it was discovered that the utility meter data had been interpreted incorrectly in the BAS, resulting in a water consumption reading that was off by a factor of 10.
By using BAS data to assess the accuracy of its meter readings, the company has established a baseline method for monitoring utility usage in its research facility, enabling continuous improvement and increased efficiency.