Are your salary, bonuses and current work conditions on par with others in the industry? Review the current report to learn where you rank among your peers
The sixth annual Consulting-Specifying Engineer salary survey of mechanical, electrical, plumbing, fire protection and lighting engineers shows that the average base annual salary in 2019 was $111,729, a 7% increase over the 2018 average of $104,349. Average nonsalary compensation was $14,255 in 2019, a 13% decrease from the 2018 nonsalary compensation of $16,358. This is a deviation from the last reporting period, when the average base salary was nearly flat compared with the previous report and nonsalary compensation was up approximately $3,000 higher than 2017 numbers, or an increase of 20.5%.
Half (49%) of all respondents said they worked at a consulting engineering firm, 15% indicated they were either an in-house engineer for government agency, public utility company, industrial/commercial institutional firm and 14% work for an architectural engineering firm. Only 11% indicated they worked for a design/build, construction/contracting firm. These numbers are based on the anonymous responses of professionals from a variety of engineering disciplines and at different levels in their professional career.
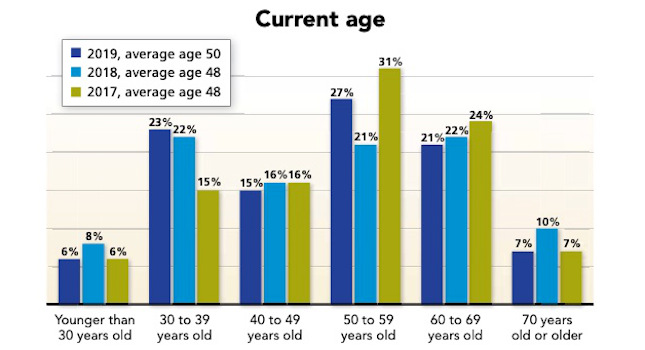
Of these respondents, 91% are male, exactly the same as last year. From the 2019 study results, 27% of respondents are 50 to 59 years old, 23% are 30 to 39 years old, 21% are 60 to 69 years old and 15% are 40 to 49 years old. This distribution creates an almost-normal bell curve with negative kurtosis.
Younger staff, defined by the U.S. Department of Labor as 40 or younger, equate to 29% — about the same as last year’s survey respondents, which reported 30% in this age group. On the flip side, at the right end of the bell curve, 28% are 60 or older.
This, coupled with the lack of technical and professional development training at engineering firms, should be a concern for several engineering firms as their technical proficiency departs. See Figure 1 for the comparison of age groups over the past several years.
The good news is that total compensation has grown for the majority of respondents. As shown in Figure 2, compensation increased 1% to 4% for 43% of respondents, 5% to 9% for 17% of respondents and 10% or more for 13% of respondents. This is similar to last year’s increase in total compensation.
Figure 1: The age of survey respondents continues to remain on the older side; most respondents are older than 40. The average age of this year’s respondents is 50, an uptick from 48 years old last year. Courtesy: Consulting-Specifying Engineer[/caption]
COVID-19 impacts
According to the survey, 14% of respondents are looking to change jobs in the next year and 19% aren’t sure, meaning close to two-thirds of employees are not looking for a new position. Because this study was conducted well into the COVID-19 pandemic, that reluctance to change to a new company is likely due to the wildly fluctuating job market.
Several things changed for survey respondents since the nationwide pandemic began:
- Required use of new online or virtual tools: 42%.
- Moved some work to remote work (working at home): 40%.
- Stopped travel completely: 39%.
- Moved all work to remote work (working at home): 37%.
- Changed company’s hiring practices: 18%.
- Seeking new clients and revenue options: 16%.
At the time of the study, 32% of respondents felt their firm was ahead of the competition, and 34% thought they were just pulling ahead.
As seen in past studies, the vast majority of respondents are either very satisfied (41%) or satisfied (48%) with their jobs. That’s a slight dip from last year’s 90% of happy employees, but still well within the margin of error.
Survey methodology
A survey was emailed to Consulting-Specifying Engineer audience members and information was collected in August and September 2020. A total of 252 qualified responses were returned, with a margin of error of +/-6.2% at a 95% confidence level. Participants frequently had the option to select more than one response, thus totals do not always equal 100%.