A corporate campus reviewed its chiller’s performance data to determine what updates were needed. Metering and instrumentation helped achieve the engineer’s goals.
Consider the operation of a central plant developed to serve the heating and cooling loads of a vibrant corporate campus in Minnesota. This 60-year-old plant has grown to include eight water-cooled centrifugal chillers. The chillers have a nameplate design capacity of 28,850 tons with effective production capacity of 26,000 tons. The plant configuration includes six steam turbine drive chillers and two electric drive chillers plus thermal storage and a plate and frame heat exchanger. High-pressure steam is produced by an adjacent steam plant.
The differential of design and effective capacity is predominantly attributable to a refrigerant conversion from R-12 to R-134A and age of chillers. The 4-million-gallon thermal storage tank can provide 35,000 ton-hours with a temperature differential of 15 degrees F. Thermal storage is used to respond to sudden spikes in chilled water demand, a back-up source of chilled water during peak electric rate periods and reserve in the event of a chiller failure during periods of high demand. The plate and frame heat exchanger provides non-mechanical chilled water production (free cooling) for building loads during off-season service, generally November through March. The heat exchanger system has a capacity of 1,275 tons.
The plant was also developed with metering and instrumentation that supports daily and monthly management reports of production (tons and ton-hours) and production efficiency and expense of production (dollars/ton-hour). The production and efficiency data also allow diagnostic evaluation of system and component failures. The diagnostic evaluation provides a basis for reviewing the effectiveness of maintenance practices and formulating capital forecasts and budgets for component replacements.
The selection of centrifugal chillers was based on the anticipated growth of chilled water demand and annual production requirements, length of service life and energy efficiency. The corresponding selection of drives for the centrifugal chillers reflected the economic considerations concurrent with the plant development. The plant was originally based on residual oil as the primary fuel for steam production, offering a significant price advantage relative to other fuel options available to the plant. The energy price point for steam production and operating efficiency of condensing steam turbines to drive centrifugal chillers was competitive with the corresponding price of electric drive centrifugal chillers. The competitive price advantage was sufficient to justify the incremental capital cost of the turbine drive and additional tower capacity required by condensing steam.
A secondary capital consideration for steam turbine drives was once related to limitations of the site infrastructure: the electric distribution system would have required significant upgrades to serve the incremental demand of electric drive chillers (beyond that of a single electric chiller circa 1965). This limitation of the electric distribution system has been addressed over the ensuing years as the campus grew, ultimately allowing the installation of a new electric chiller in 2005. The plant made the transition to natural gas as primary fuel and distillate oil as secondary fuel due to long-term availability of residual oil, eroding price advantage and air permit issues.
Evaluating efficiency
Given the magnitude of changes that have transpired since the plant started operations, the client wanted to know if the plant was operating efficiently and with lowest operating expense. The metering and instrumentation of the plant allowed a substantive and quantitative review of chilled water production, efficiency of chilled water production and corresponding operating expense, inclusive of labor, fuel, electricity and maintenance.
An evaluation of the chiller operation indicated annual production of approximately 31 million ton-hours per year of mechanical cooling, with most production occurring between 20 percent and 45 percent of plant capacity. This evaluation established the hourly baseline profile of chilled water production and chilled water demand over an entire cooling season. Peak chilled water demand exceeds 25,000 tons during the summer cooling season (June through September) with a baseload of 5,000 tons for the remainder of the 6,000-hour mechanical cooling season (March through October).
Steam turbine drive chillers account for 80 percent of effective capacity and about two-thirds of annual chilled water ton-hour production. The remaining third of chilled water production is from electric drive chillers, which comprise the remaining 20 percent of effective plant capacity. Dispatch of chillers for chilled water production is manually selected by the operators. Relative order of dispatch is typically a function of chiller availability (operational or down for maintenance), cooling demand and chiller efficiency as determined by the daily and monthly management reports. While chillers have been generally selected for operation in order of efficiency (highest efficiency to lowest), the baseline evaluation also revealed that chiller dispatch had become a matter of operator preference rather than a selection based on energy efficiency or operating expense.
The hourly demand profile of this baseline production was reevaluated to consider the potential effects of two dispatch strategies in lieu of operator preference:
- Efficiency dispatch: Dispatching steam turbine drive chillers solely on the basis of turbine efficiency and without any change to chilled water production by electric drive chillers.
- Economic dispatch: Dispatch of all chillers, steam and electric drive, on the basis of efficiency and energy expense.
The only change between baseline operations and the dispatch strategies was a deliberate sequencing of chiller operation in response to hourly chilled water demand. All other service requirements (supply temperature and system flow rates) were maintained.
The efficiency dispatch reassigns the chilled water production of the steam turbine drive chillers in order of efficiency, ranging from 7.83 to 13.3 pound/ton-hour. The exercise indicated that total steam consumption necessary for operation of the steam turbine chillers could be reduced by approximately 13 percent compared to baseline.
Economic dispatch adds management of electric drive chillers, dispatched in order of efficiency relative to the time-of-use rates of the local utility. During on-peak periods chilled water production is assigned to the most efficient steam turbine drive chillers, those requiring less than 10 pound/ton-hour, followed by the electric chillers and then the remaining steam turbine drive chillers as necessary. Conversely, during off-peak periods chilled water production is first assigned to the most efficient electric drive chillers, followed by steam turbine drive chillers in order of efficiency. The evaluation of economic dispatch indicates that chilled water production by the steam turbines chillers is reduced by 15 percent and steam consumption is reduced by 28 percent compared to baseline. The share of total chilled water production by the electric chillers increase from about 33 percent to 43 percent (compared to the baseline).
The potential change in operating expense is dependent upon variations of the hourly chilled water demand profile and annual chilled water production and is also related to the underlying price of energy, notably that of natural gas for steam production and purchased electric service. Electric service is purchased through a time of day tariff consisting of a monthly peak electric demand charge and on-peak and off-peak energy charge. Using the prevailing energy prices, a shift to dispatch of chillers on the basis of efficiency and time of use offers a $490,000 reduction in annual operating expense.
It is important to note that this potential magnitude of avoided expense could be realized through a change in operating protocol with virtually no capital expenditure and was identified through a comprehensive review of the performance data collected by the plant metering and instrumentation.
Further potential operating savings were discovered through parametric analysis of cooling tower and chiller performance data. Performance of the cooling tower is a function of the physical characteristics of the tower, fan speed and motor horsepower and ambient wet-bulb conditions. Cooling tower performance also directly impacts the efficiency of all chilled water production.
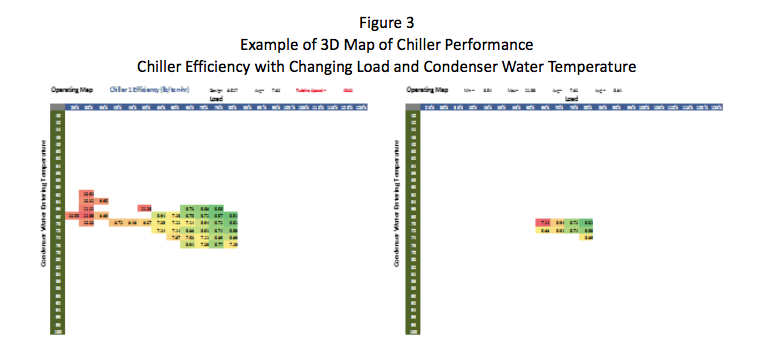
The efficiency of chilled water production can be improved by reducing the “lift” experienced by the chiller’s compressor: the difference of entering tower water temperature and the chiller’s chilled water supply temperature. As this temperature differential is reduced, the work done by the compressor is also reduced: less electric usage by the compressor motor or less steam usage by the turbine.
The parametric analysis, as seen in Figure 3, illustrates the potential variation of chiller efficiency (kW/ton or pound/ton-hour) with reduction of condenser/tower water entering temperature at various chiller loads. Using the baseline hourly profile of chilled water production and performance, a potential lower tower water supply temperature was determined for each hour of operation. Tower operations were managed to yield a 6 to 7 degree average reduction in lift on the chillers. The performance of the electric chillers improves by 0.04 kW/ton and the steam turbine drives chillers improves by 1.5 pound/ton-hour. Given these improvements in chiller performance, managing the towers for cooler condenser water temperatures can further reduce operating expense by approximately $110,000.
Operating data from the thermal storage system was then evaluated relative to the local electric utility rates (month demand charges and on-peak, off-peak energy charges). This evaluation revealed several instances of charging the storage system during on-peak rate periods. The baseline hourly profile indicated that virtually all off of these instances could have been deferred to off-peak rate periods. A formal policy governing use of the thermal storage system could yield significant savings, again without capital expenditure. The baseline profile and chilled water production trend data indicates a potential expense reduction of approximately $30,000, simply by restricting charging of the thermal storage system to off-peak rate periods when possible.
The total potential annual expense reduction identified through the evaluation the data from the plant metering and instrumentation system is $630,000: $490,000 through dispatch strategies, $110,000 by changing cooling tower operations and $30,000 from managing the thermal storage system.
The metering and instrumentation system consists of PLC based controls communicating with a modbus protocol to a human machine interface. All data is stored on a historian, with data intervals of one second. The database was queried to obtain 15-minutes averages for 583 discrete points, yielding 14 million data points.
These expense reductions and associated changes in operating strategies are defined many years after initial selection of chillers and equipment and quantified through evaluation of data collected by the metering and instrumentation that had been installed as part of the plant development.
Not every chiller installation has the magnitude of this plant in terms of capacity and production. Most chiller installations cannot justify the full scale of metering and instrumentation that document the performance of this plant. However, absent some provisions for even the most basic metering and storage of chilled water production and energy consumption, the ongoing efficiency of chiller operations cannot be monitored or verified beyond the initial selection process.
Engineers, owners and contractors should carefully evaluate metering and instrumentation of chiller plants so that ongoing evaluation of the most efficient operation may be conducted throughout the life of the plant.