Building operations are challenged by insufficient financial and human resources and ever-expanding scopes of responsibility. Systems integration and analytics are a means of doing more with less.
The past decade has seen dramatic advances in automation systems and smart devices. With today’s IP-connected systems employing a variety of standard protocols and Web services, it is now relatively simple to access and accumulate data produced by the wide range of devices in buildings. As a consequence, the amount of available data per building has grown, and with it in many cases the number of buildings that have to be managed. We find ourselves paradoxically drowning in oceans of data with little or no information to work with.
The challenge facing today’s overburdened managers and operations staffs is information prioritization. The ideal targeted by today’s systems integration professionals is to execute this prioritization with little to no hands-on effort, devising software to scan equipment systems’ patterns for variations and faults.
The industry has met each installment of increasingly stringent ASHRAE 90.1 standards—driven by volatile resource economies and urgent environmental imperatives—with additions to the arsenal of automation and measurement technologies and strategies, helping emerging low-energy technologies enter the marketplace. The latest in systems integration, demonstrated in a recent paradigm-changing research lab and elsewhere, harnesses the analytics we’ll depend on to navigate the challenging waters ahead.
The challenge: Turn data into actionable intelligence
From BAS to electric meters, thermostats, and individual sensors, a polyglot assortment of smart devices are producing information about their environments and operations. The first challenge is how to bring all these data together in a consistent manner, in other words, how to “normalize” the data. Without this, all we have are “islands of information” that require manual intervention in order to correlate data in one system with data from another system. To avoid this considerable manual effort, prudent building managers are unifying the data into a common, integrated architecture.
By using software and enabling digital control, BAS are superior to isolated sensors (as well as the electromechanical controls and manual collection of information they replace) for capturing and storing huge amounts of data. Yet for all their sophistication, they are both under-used and ill-suited to provide pertinent information, for example, conveying a deteriorating condition in the operation of a piece of equipment. It’s not that data aren’t there—the information usually is—but, again, finding everything is at best a difficult and tedious task that is typically beyond the capacity of most operators.
Meanwhile, these other data points in systems that aren’t part of the BAS defy inclusion with their own idiosyncratic methods of capturing, storing, and looking at data, thus requiring more time, more training, additional skills, or even more staff. Consequently, the ability to correlate this data and have it provide meaningful information is all but lost.
The industry’s acceptance of measurement and verification (M+V) has been an important step toward highlighting the value of enhancing the quality of data provided to building managers. Harnessing the processing power of today’s BAS platforms to capture data, typical M+V installations can provide trends and reporting to operations staff. However, due in part to their lack of true analytics, many M+V systems are relegated to providing basic, high-level information about energy performance on building dashboards.
Building managers are increasingly turning to open source systems integration (SI) platforms to manage their operations. These platforms build from the best available control and automation technologies, can easily provide data and information required for M+V functionality, and deploy a suite of analytics applications that can identify items requiring attention in real time.
Individual, functionally intense building projects present some of the most complex challenges to designing analytics. Portfolios of multiple less complex buildings being considered simultaneously, possibly in campus environments, can present similar challenges. Ensuring that analytics from each building’s BAS are comparable is an important initial step.
When building control systems are implemented, control sequences are written based on a best understanding of the building and equipment systems, past experience, assumptions, and the information available at the time. While these control sequences often incorporate “feedback loops,” the only feedback they respond to is the value of the variable they are attempting to control. Verifying that these sequences are working correctly, continue to operate as expected, and haven’t been interfered with or overridden by human operators is a common problem—essentially an impossible task for building personnel to manage. There is too much data, and the equipment and systems are too complex, particularly in highly integrated buildings. Given that almost all buildings are different and that fewer people are available with the necessary knowledge of systems, it’s understandable that buildings rarely operate at maximum efficiency.
To accomplish this requires first addressing the differences in the building systems themselves; each has its own methods and limits for data collection, storage, and reporting, and its own method for setup and programming. An additional concern for multibuilding and multisite users is providing an ability to assess the enterprise. Surveying a diverse array of systems in multiple buildings so that data can be compared for benchmarking, identifying best practices, and correlating the building information with business information provide a better understanding of costs and potential improvements in efficiency, sustainability, and performance.
Once the data are “normalized,” the next step is to use analytics to transform data into information. Much more than just a report generator or a way to provide multiple views of the data, analytics allows domain experts to capture their knowledge in “rules” that automatically run against the data. Employing “semantic tagging,” pattern recognition, functional rules processing, and other techniques, the analytics engine can automatically identify issues worthy of attention. This provides the capability to show users what they need to know about the performance of their systems and to unlock the data so meaningful action can be taken to reduce cost and improve efficiency, sustaining financially viable operation.
Examples of these analytics include failure detection (sensors), efficiency monitoring (economizers), cost correlation, and consumption or operating profiles that compare utility costs to production output under specific conditions, time ranges, rate values, and weather parameters. With the proper domain knowledge, virtually anything can be captured in an analytics “rule” in order to become the “eyes and ears” of the systems and ensure performance. Furthermore, attaching a cost impact to rules associated with failures or efficiency provides a method to prioritize actions based on actual cost impact to the business, rather than merely reporting frequency and duration of the issue.
With this richness of information, building management and operations staff can prioritize their activities and use their limited operating budgets and human resources to methodically address building issues that are the most important (i.e., the most expensive to ignore).
Using SI-based analytics
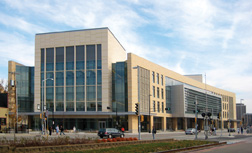
As a global standard-setting biomedical research center, the 300,000-sq-ft Wisconsin Institutes for Discovery (WID) at the University of Wisconsin-Madison represents state-of-the-art and state-of-the-future strategies for implementing and benefiting from SI-based analytics. In operation since December 2010, this highly complex facility supports interwoven institutional, organizational, educational, environmental, and social goals in addition to two research entities, one public and one private.
The present function and future potential of the WID facility are dependent on the engineered systems supporting its program of interdisciplinary collaboration. The various lab requirements are specific to cellular and molecular biology, biochemistry, organic synthesis, genetics, chemical engineering, computational modeling, bioinformatics, and biomedical engineering. On the principle that breakthroughs are found in the constantly evolving confluences of otherwise discrete disciplines—and with a mission of accelerating new knowledge improving human health and well-being—the lab spaces are readily reconfigurable. The facility as a whole is designed to accommodate the unknown technologies and research methodologies of the future, to the extent of a viable 100-year lifespan. The degree to which the facility can learn from itself, providing feedback to operators and users alike, allows it to anticipate and adapt to change. This is a vital priority, with analytics at the heart of the “mission-driven, mission-driving building” concept.
The building technologies required to meet the unique goals of the project were necessarily advanced and often inherently complex, as compared with most commercial building systems. The multifaceted nature of the architectural spaces—including large-volume atriums and restaurants open to the public, biological and chemical laboratories dedicated to academic research, undergraduate teaching laboratories, and high-tech conference and event space—required tailored solutions for such systems as HVAC, lighting, life safety, access control, and scientific processes. This high degree to which systems were customized to various spaces created a demand for specific control and automation technologies.
In addition to its functional requirements, WID, from its earliest conception, was planned to be aggressively energy-efficient and sustainable, with a 50% reduction in CO2 emissions and a 50% reduction in water use, relative to similar research buildings. Technologies and strategies to reduce energy consumption include exhaust heat recovery, chilled beam, LED task lighting, daylight harvesting, ground source heat exchange, geothermal heat pumps, and solar generation of domestic hot water.
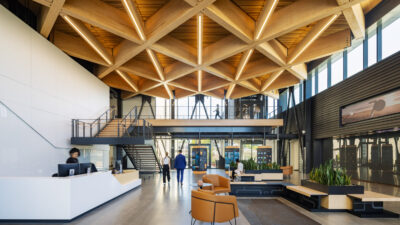
Throughout the open ground floor of WID are public interfaces documenting building performance, alongside displays of research taking place in the building. These components demonstrate the public and educational outreach commitments of “The Wisconsin Idea,” the university’s century-old guiding principle that it should improve the lives of people beyond the classroom. A robust M+V system was envisioned to achieve these public interfaces. However, as the project developed, the concept of public interfaces evolved to include resource use displays (e.g., energy, water) in a manner that could be educational to the general public and regular building occupants and, importantly, impact the behaviors of the building occupants. Additionally, project leadership sought to ensure that the high-performance energy goals would be continuously achieved over the lifecycle of the building. As such, a significantly more refined measurement, control, and verification system was identified as a critical component of the project’s long-term success. This took the form of an intelligent building architecture, or IBA.
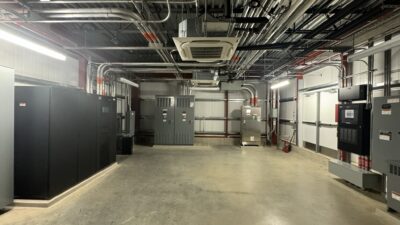
The IBA is the chassis upon which systems integration is achieved, effectively aggregating data from the complete cross-section of automation and control subsystems and devices deployed throughout the facility. As illustrated in the systems integration architecture diagram, the WID systems use technologies and protocols including BACnet, Internet protocol (IP), transmission control protocol (TCP), simple network management protocol (SNMP), Modbus, Ethernet, and various automation protocols for programmable logic controllers (PLC). While several options exist to create an IBA, the WID project used the Niagara Framework software platform to create the integration backbone. The Niagara Framework provides the connectivity to the various subsystems and devices, “normalizes” the data and resolves tagging and modeling issues with the various systems, and provides the “glue” logic to tie the data together and perform control across the boundaries of the individual systems and devices. The selected software was used to directly control/monitor domestic water meters, natural gas meters, solar hot water system components, laboratory equipment, public water features, laboratory gas bulk tanks, and laboratory process chilled water meters.
The software platform is agnostic to control protocol or manufacturer, and therefore readily integrates the diverse devices and communication protocols throughout the building. The IBA uses this fully open, Web-based protocol so that all information and graphics are accessible through conventional Web browsers, thus no proprietary software was required to be installed on any user workstations. The IBA and its Web interfaces facilitate user friendly management and real-time control of the building systems.
Project Haystack
One of the biggest challenges to integrating data and applying the subsequent combined dataset to advanced applications is data modeling. Data modeling ensures that the data being analyzed and reported on is correct and applicable for the analysis being performed. Lacking any standards for data modeling, naming, and tagging, an industry initiative is underway to address this problem.
Project Haystack is an open source initiative to develop naming conventions and taxonomies for building equipment and operational data. It defines standardized data models for sites, equipment, and points related to energy, HVAC, lighting, and other environmental systems.
Today most operational data requires a manual, labor-intensive process to "map" the data before any analytics can begin. Pragmatic use of naming conventions and taxonomies can improve the cost-effectiveness of performing analytics, deriving greater value from operational data.
Regardless of the technology used, some challenges to providing an integrated architecture still remain. Coordination with all the subsystem suppliers is critical; changes they make need to be communicated to the team to minimize impact to schedule and effort. Another very fundamental yet often overlooked consideration is to ensure a clear and common understanding among the various audiences for the information, making sure that the information and its presentation serves the needs of all audiences and is tailored to their respective uses and levels of understanding. While this is critical for all projects, it was amplified at WID because of the diverse types and needs of the audiences, including biomedical researchers, building operators, public visitors of all ages, and building engineering researchers. Each of these groups has different needs regarding the information, ranging from basic education to detailed historical analysis.
Building user benefits: Once the IBA system was developed, the project’s goal of instilling occupants’ awareness of their own usage patterns could be initiated. In terms of energy consumption in the WID facility, scientific researchers are a critical building occupant group. Using the IBA to monitor receptacle load, lighting status, supply and exhaust air flows, supply air reheat coil inlet and outlet temperatures (via integrated laboratory controls vendor interface), and supplemental cooling using chilled beams, a complete space-level energy consumption profile is developed for each laboratory area of the building (referred to as a “pod”). Energy information is provided to occupants via displays indicating energy consumption factors totalized and trended for the past day, week, month, and year. In addition to tracking information on their space and equipment, researchers can receive notification of equipment alarms indicating circumstances possibly affecting their work.
Building operator benefits: “Normalizing” the information means the operators have a consistent method to view and interact with real-time information, alarms, schedules, and histories. This relieves the burden of having to master multiple software interfaces and techniques for something as simple as, say, changing a time-of-day schedule that affects multiple systems (HVAC, lighting, etc.). In some cases the normalization effort can eliminate the need for multiple proprietary software packages that require use training, initial capital expenditures, and annual licensing fees resulting in savings of hundreds of thousands of dollars.
General public benefits: As an educational facility where the public is invited to learn about the research being conducted, the building and its information are also on display to the public. Here the IBA combines real-time operating data, historical consumption data, and educational graphics about the systems in the building to facilitate a visitor’s understanding of how the building works and how it is performing.
Building engineering researchers’ benefits: Building engineering researchers see the benefit in IBA because it provides them with greater access to data. This group, unlike the other audiences, is not interested in graphics or dashboards. They want the ability to find data, oftentimes from disparate systems, and to do so quickly and efficiently. IBA allows them to do that without the need to learn multiple system interfaces and provides ready access to the data they need to support their research.
Systems integration and analytics
The WID project represents a uniquely complex facility with demanding performance standards prescribed from its earliest inception. In these respects the application of analytics and system integration were immediate to the program of the facility. Appreciable benefits can also be achieved in facilities—or across a facility portfolio—of less complexity, but of greater scale. Foremost is the potential for significant energy and operational savings offered by the combination of an integrated architecture and a rich analytics platform. The key to unlocking this potential lies in being able to identify where the opportunities are. Several recent strategies offer representative approaches to leveraging SI and analytics, specific to users’ unique operations.
Energy management: Establishing accurate target setpoints for energy consumption is a key part of most energy efficiency projects, whether it is a lighting retrofit or replacement of HVAC equipment. For example, in one instance finding periods of time that deviate from desired operation resulted in the corrective action of establishing demand reduction sequences via analytics, producing a lower energy consumption profile and annual savings of $1.4 million across 420 sites, totaling 33 million sq ft. Continuous, automated oversight notifies operators of deviations from the desired energy baseline, enabling real-time investigation and corrective action if necessary.
Maintenance and operations: Nonfunctioning sensors and actuators result in significant waste of energy, occupant discomfort, excess of equipment wear and tear, and process inefficiency. What’s worse, for all their potential value, many devices aren’t working and nobody even knows it. Numerous studies have shown that it is not uncommon to find over 50% of economizers in rooftop applications to be nonfunctional or not functioning properly. These conditions can go unnoticed indefinitely if their discovery depends on looking at every trend log to identify a value, condition, or pattern, an approach obviated by a targeted analytics platform. In this way, one operator identified lighting and HVAC equipment left in manual override, resulting in operating procedure changes and control sequence modifications yielding $650,000 in annual savings across 165 sites. Another used detection of failed sensors and economizers to prioritize work orders, providing $800,000 in annual operation and maintenance savings across 128 sites totaling 23 million sq ft.
Improving efficiency: Achieving desired comfort conditions while using the lowest amount of energy possible is subject to the complexities of program and locale. And watching the operating characteristics of all systems and their interaction with one another in real time is impossible to do manually. By first integrating the data from various systems together into one architecture and then applying rules through an analytics application, it is possible to achieve significant energy savings and improve comfort. One operator identified periods of time when cooling and heating were operating simultaneously, and when outside air (above the minimum required) was being brought in during heating mode, changed control sequences and realized savings of more than $325,000 annually across 67 sites.
Walters is a principal with the energy planning firm Confluenc. Formerly director of Affiliated Engineers’ sustainability practice, Walters led the energy-efficiency strategies for WID. Oswald is president of Environmental Systems Inc. (ESI). ESI provides solutions for automation, systems integration, security, life safety, advanced software applications, energy services, and building operations.