Sustainability
Boilers, Chillers
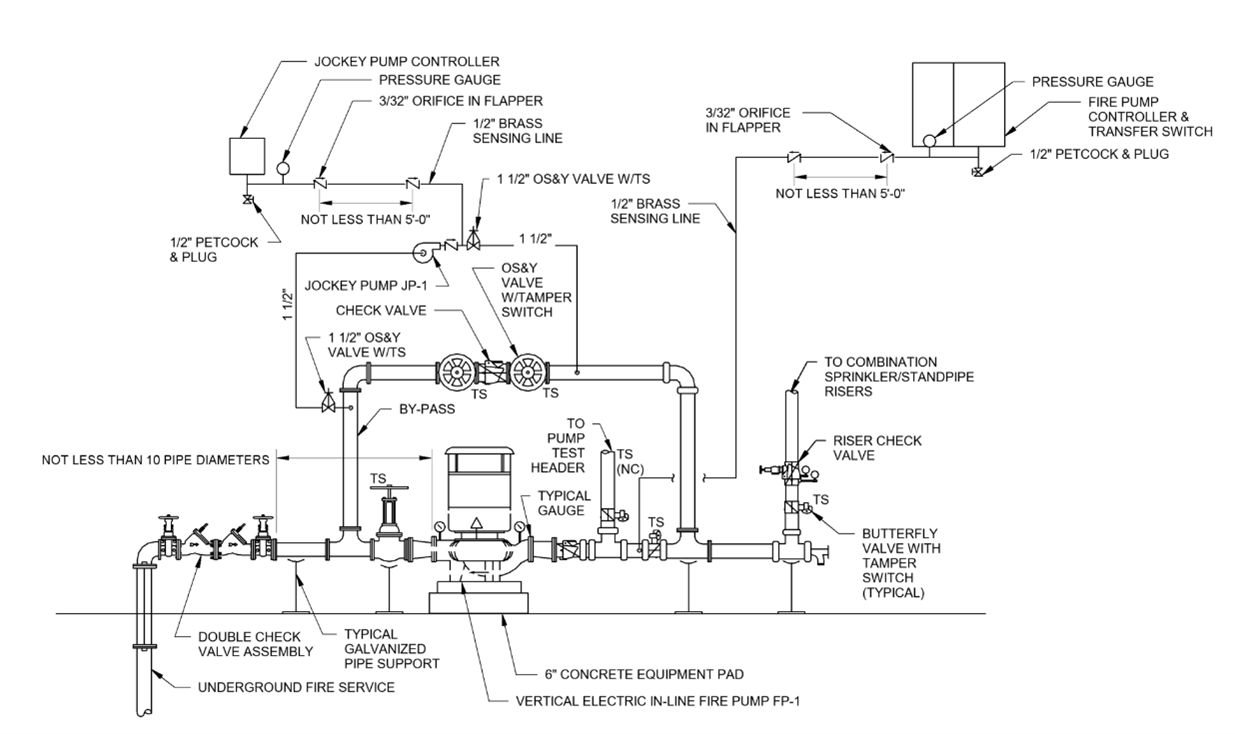
Fire and Life Safety
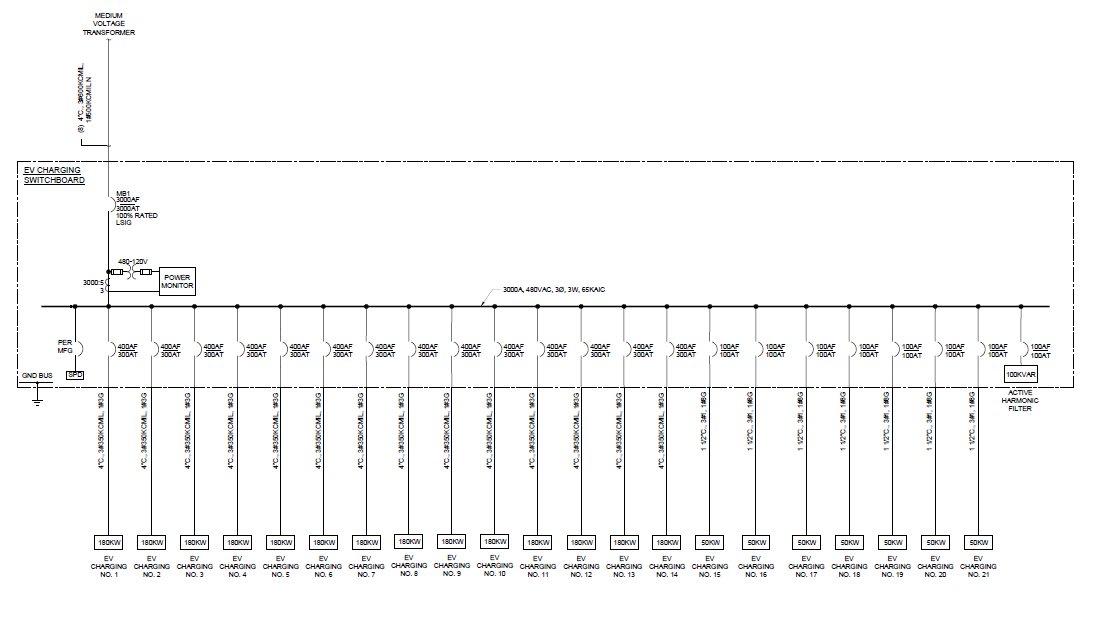
Electrical and Power
Awards
Codes and Standards
Building Automation and Controls
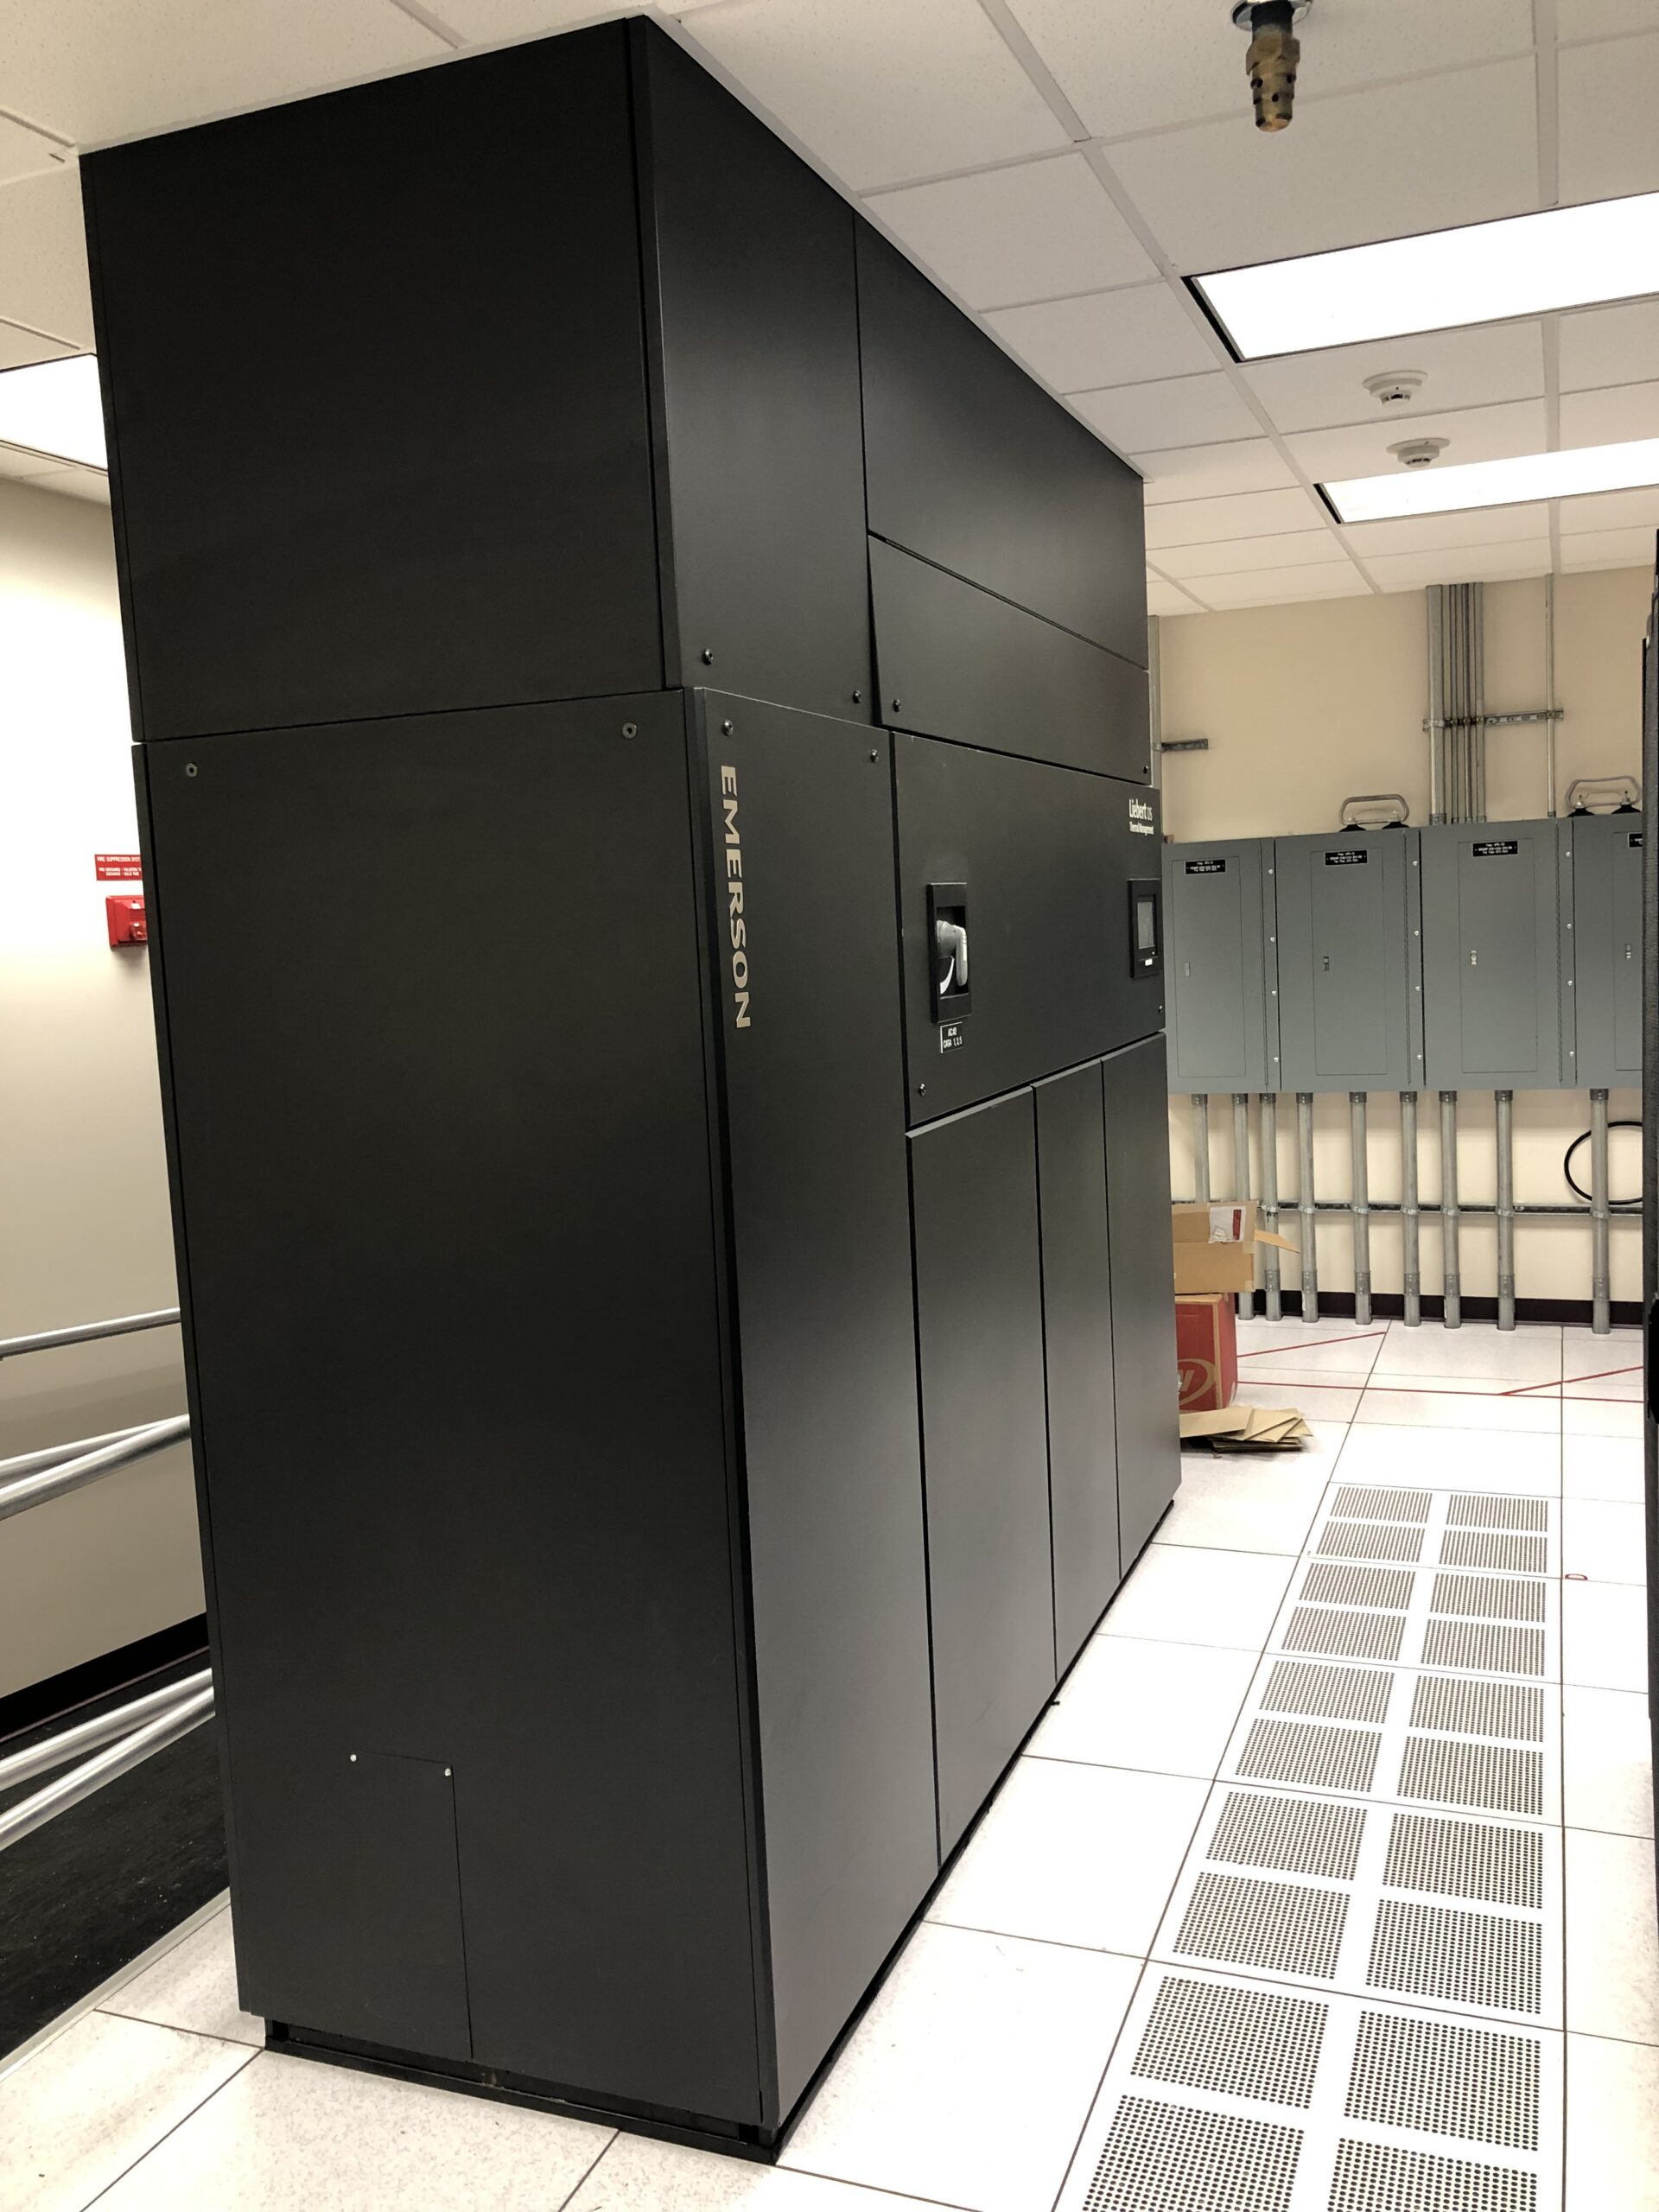
Data Centers
Case Study